Finding the Story in Data
Who should a WNBA team sign, and how much should they offer?
For this class project, I chose to work with WNBA player performance and salary data. My job was to turn it into a signing recommendation. I completed the analysis and presentation myself, from cleaning the spreadsheet to deciding which findings were worth putting in front of an audience.
There were plenty of numbers to work with. The harder question was which ones would help a team make a decision.
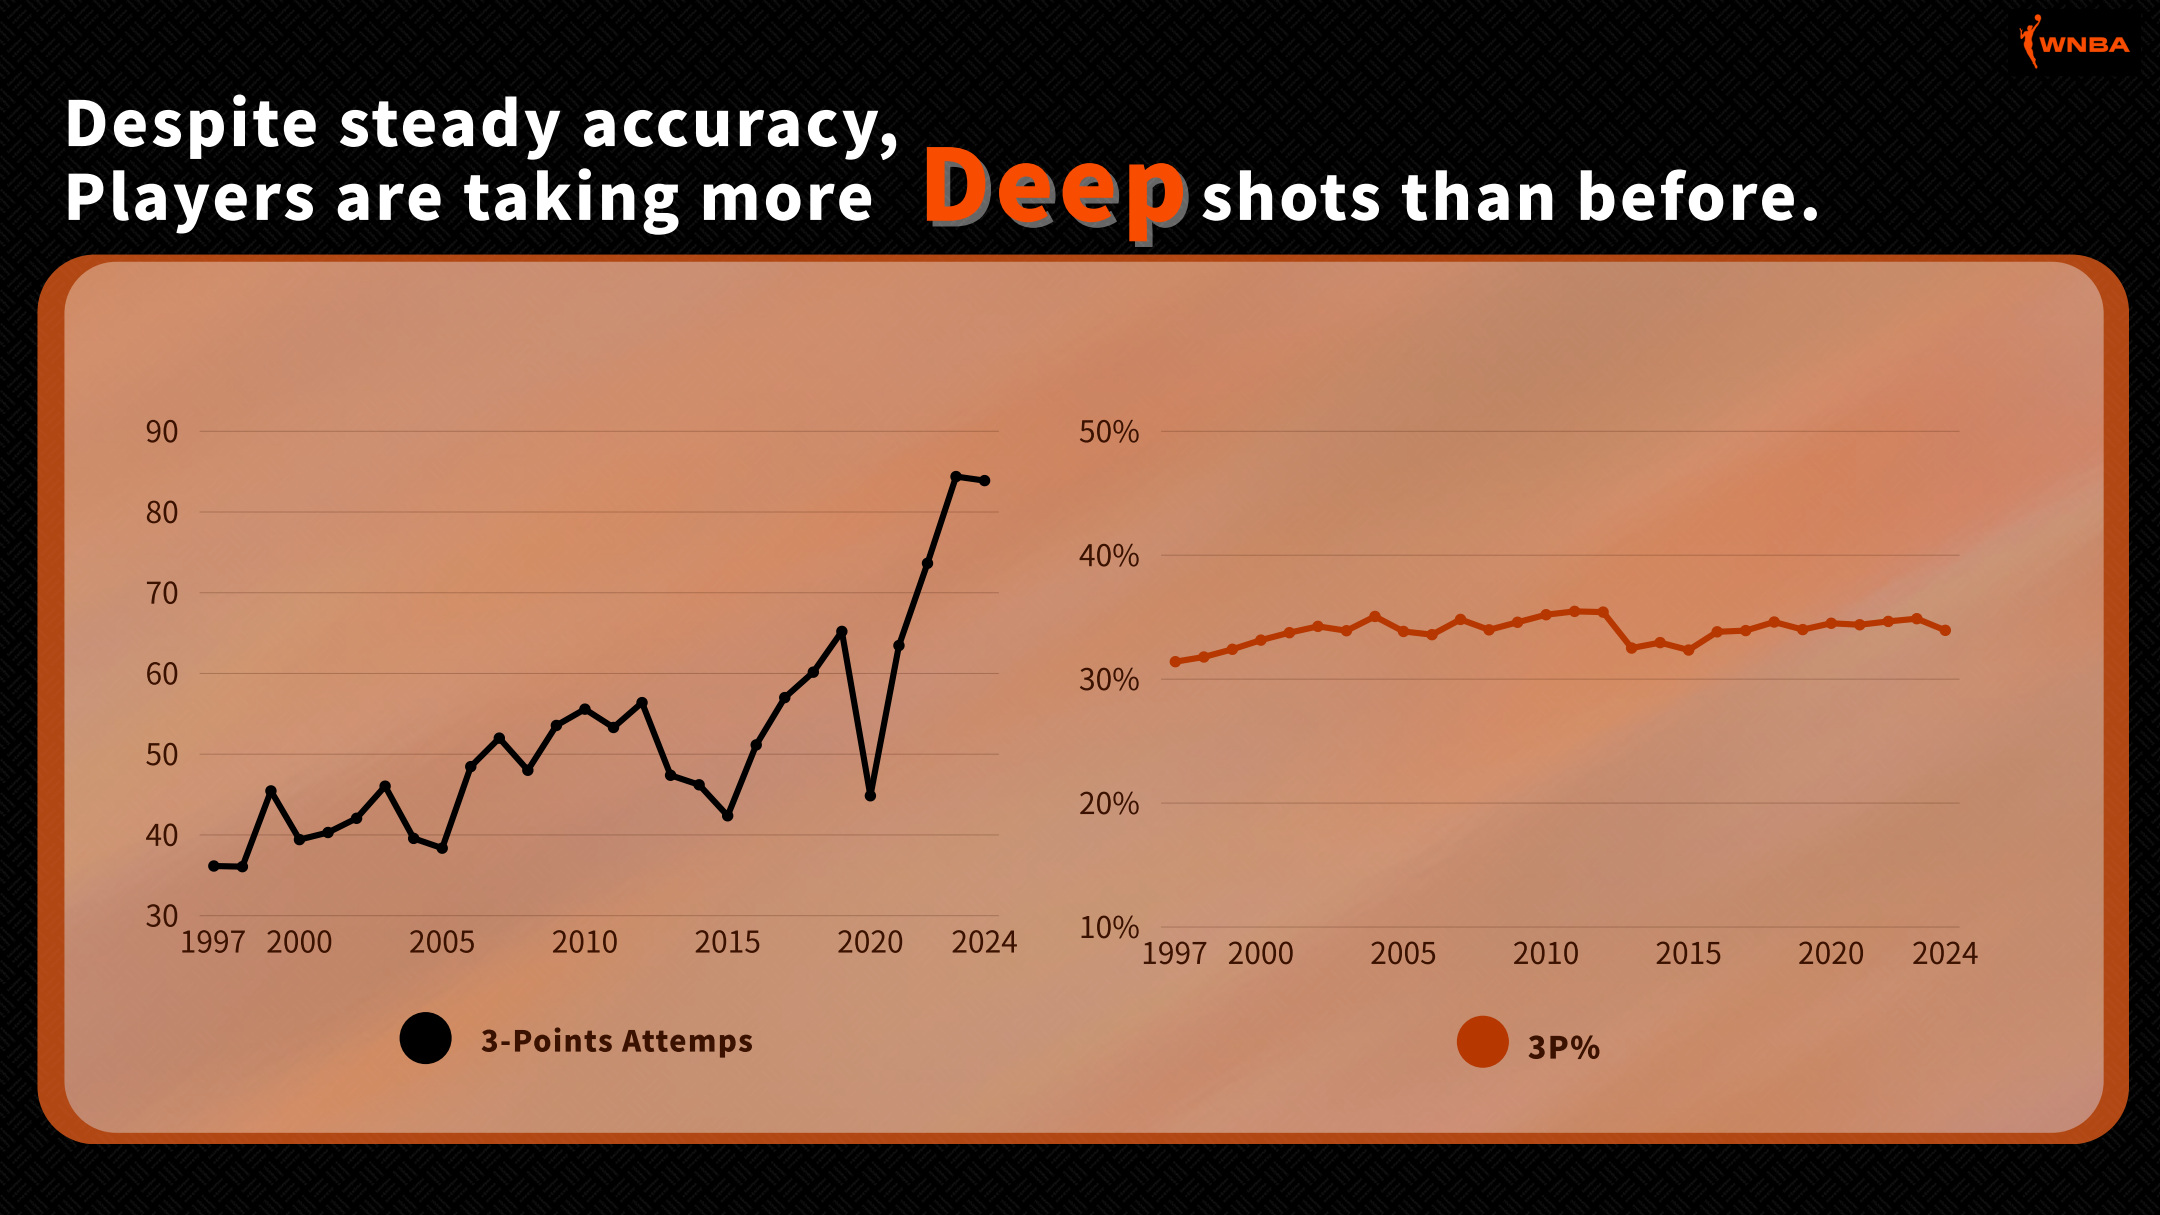
I started with the bigger picture. Looking across seasons from 1997 to 2024, I saw increases in assists and three-point attempts, while three-point accuracy changed much less. Defensive rebounds had also risen more noticeably than offensive rebounds.
I read those patterns as signs of a changing game, with more outside shooting and a growing role for shared offense. They gave me context. To get closer to a signing recommendation, though, I needed to look at what different players were being asked to do.
Different positions bring different things to a team, so I separated players before comparing their performance.
A guard’s ability to create opportunities and take care of the ball mattered to my analysis in a different way from a center’s rebounding and rim protection. Using the same measures for everyone could hide the contributions I was trying to understand.
I used the statistics featured by ESPN and the WNBA as a starting point, then chose the combinations I thought were most useful for each position. Before making those comparisons, I filtered out player-season records with fewer than ten games or less than eight minutes per game. That left 3,568 records from the original 4,507.
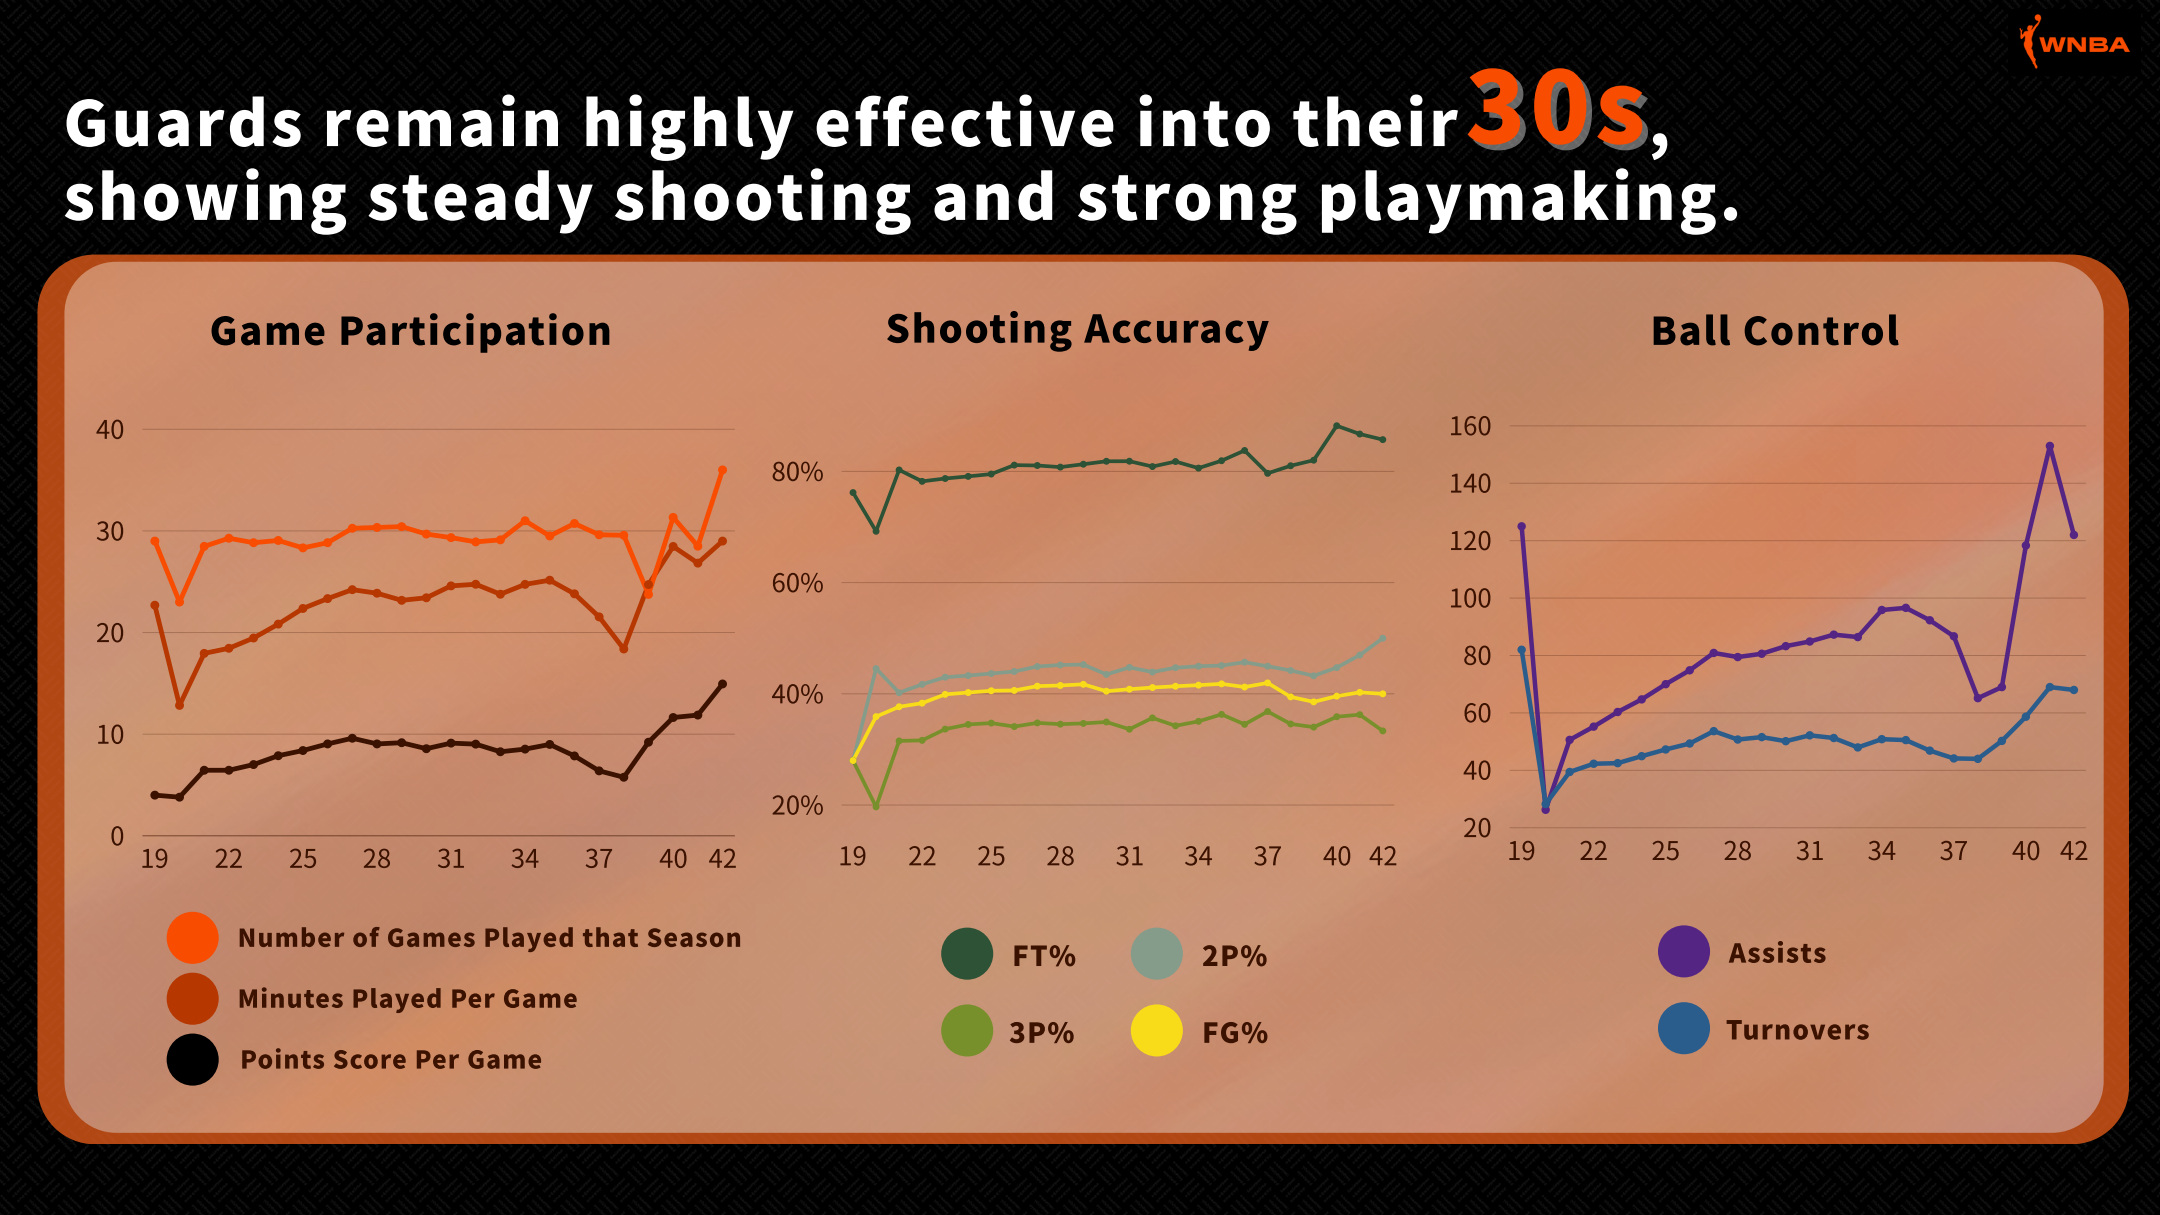
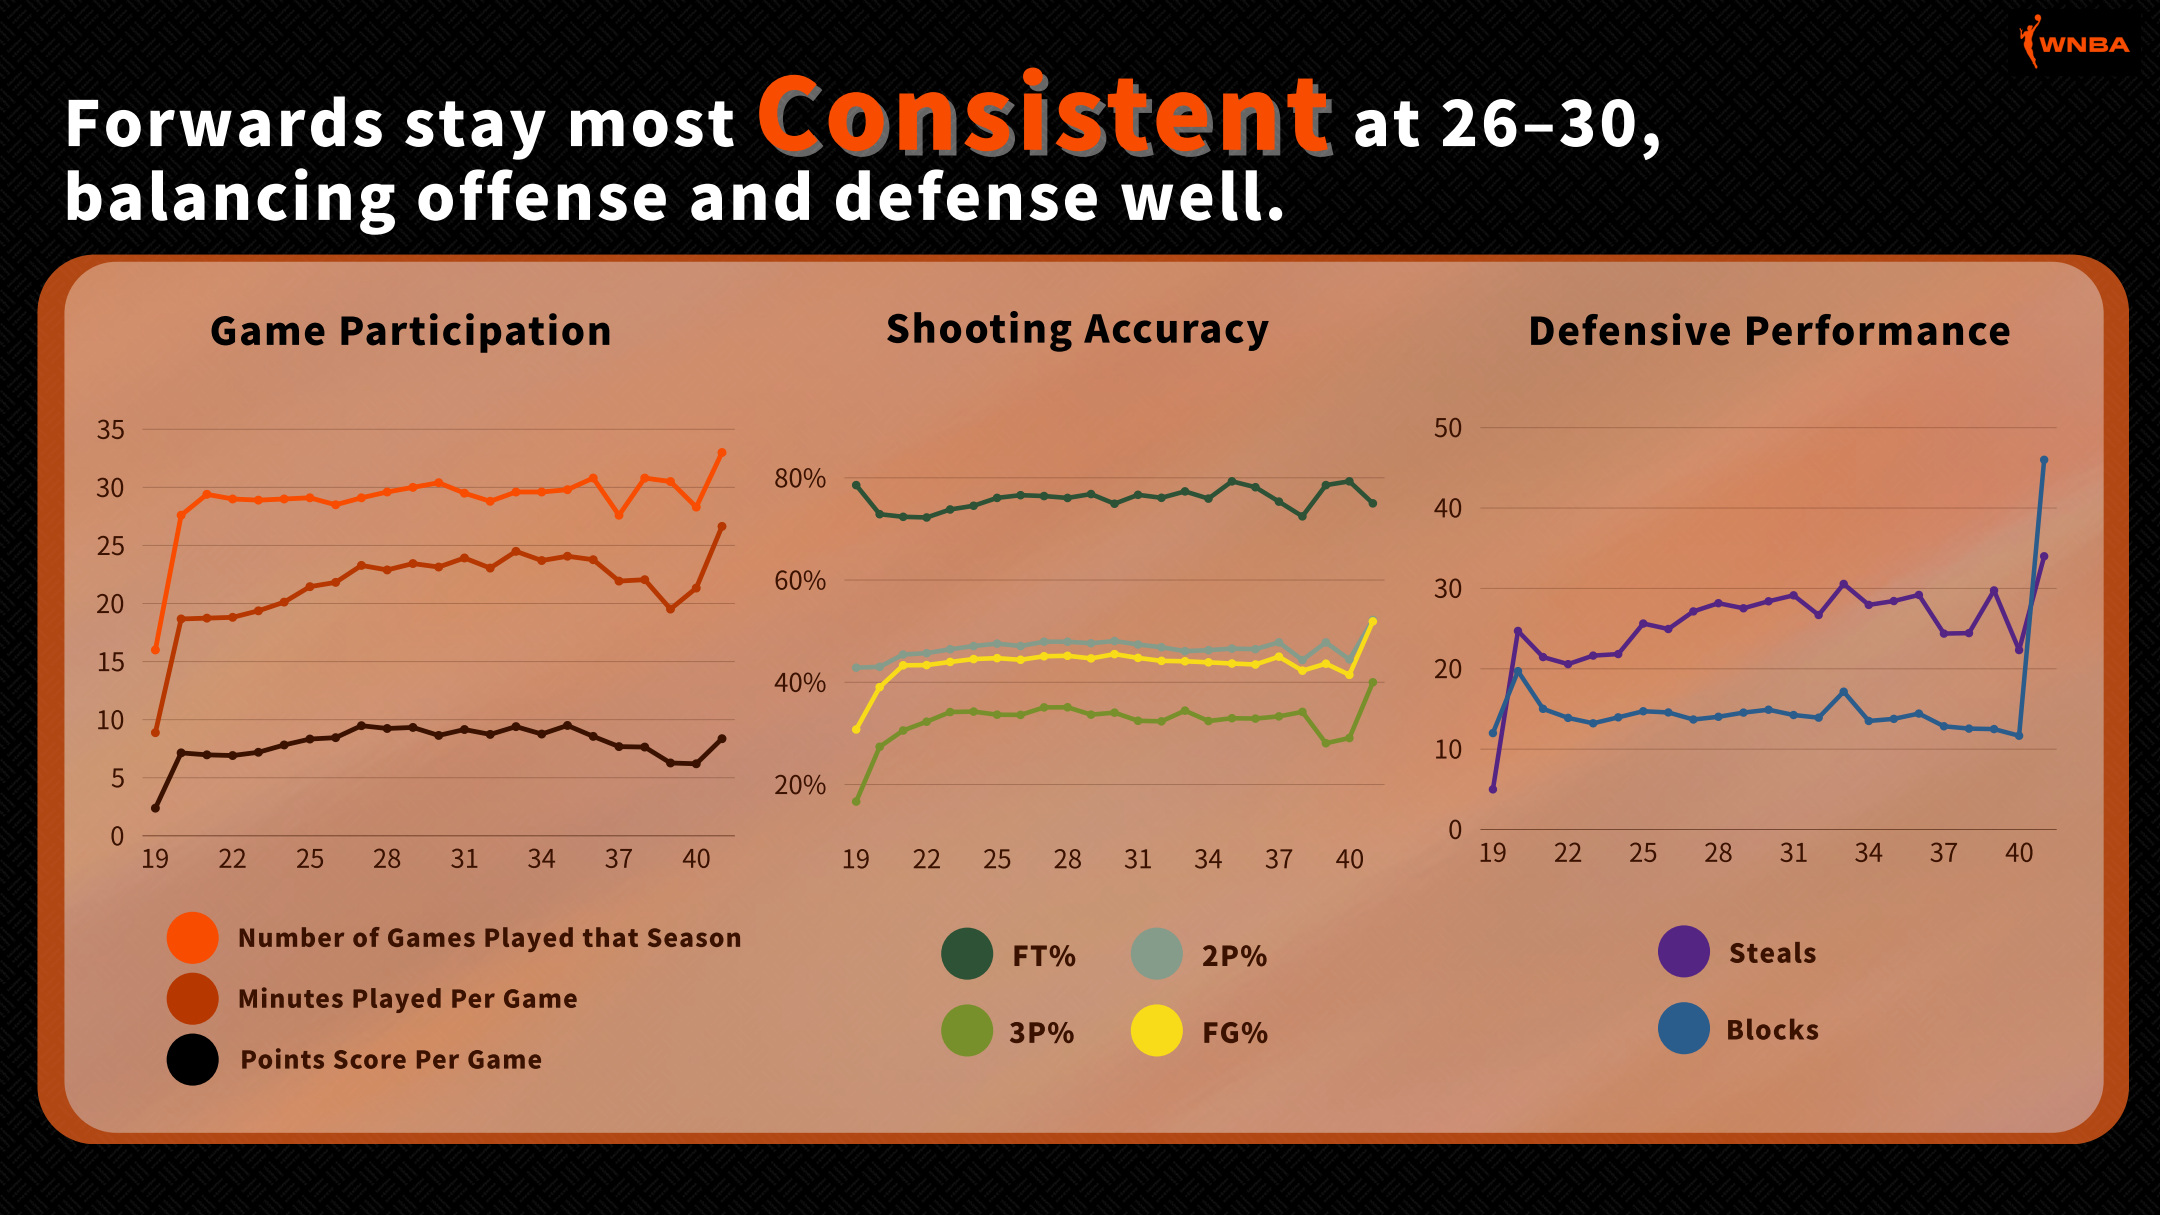
For guards, I looked at shooting accuracy alongside assists and turnovers. For forwards, I considered shooting and defensive contributions through steals and blocks. For centers, I focused more on rebounds and blocks. Games and minutes played helped put those performances in context across all three positions.
Guards caught my attention. Around their thirties, shooting remained relatively steady, while assists compared favorably with turnovers. That made me look more closely at experienced guards rather than assume a younger player would automatically be the better choice.
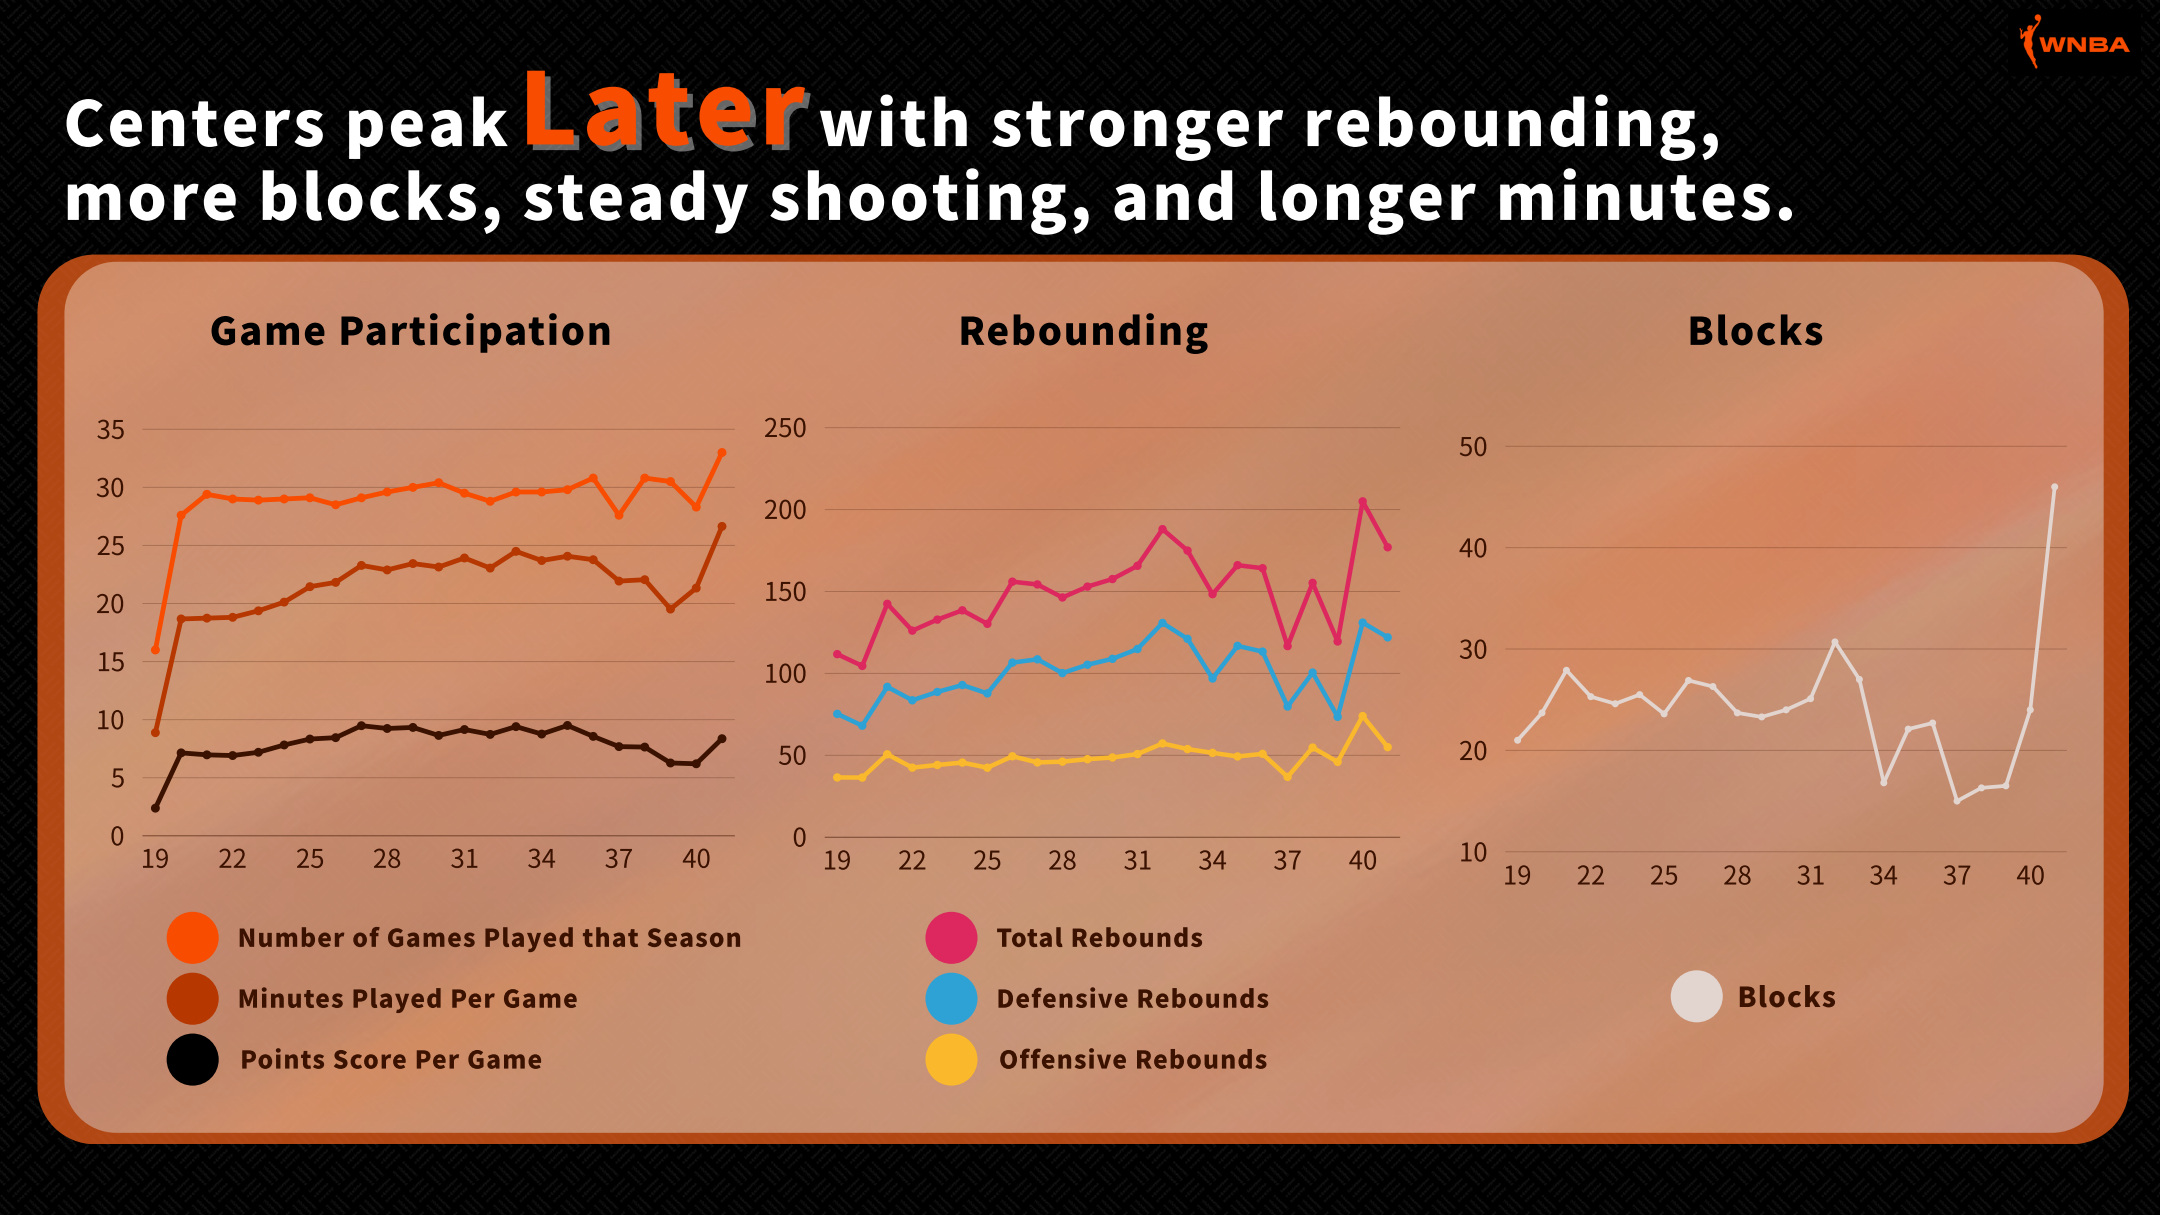
Forwards showed a useful balance of offensive and defensive contributions through their mid-to-late twenties. Centers gave me another reason to consider experience, with strong rebounding in their late twenties and early thirties.
I was beginning to see different age windows worth exploring for each position.
I also wanted to question some assumptions about who could still contribute.
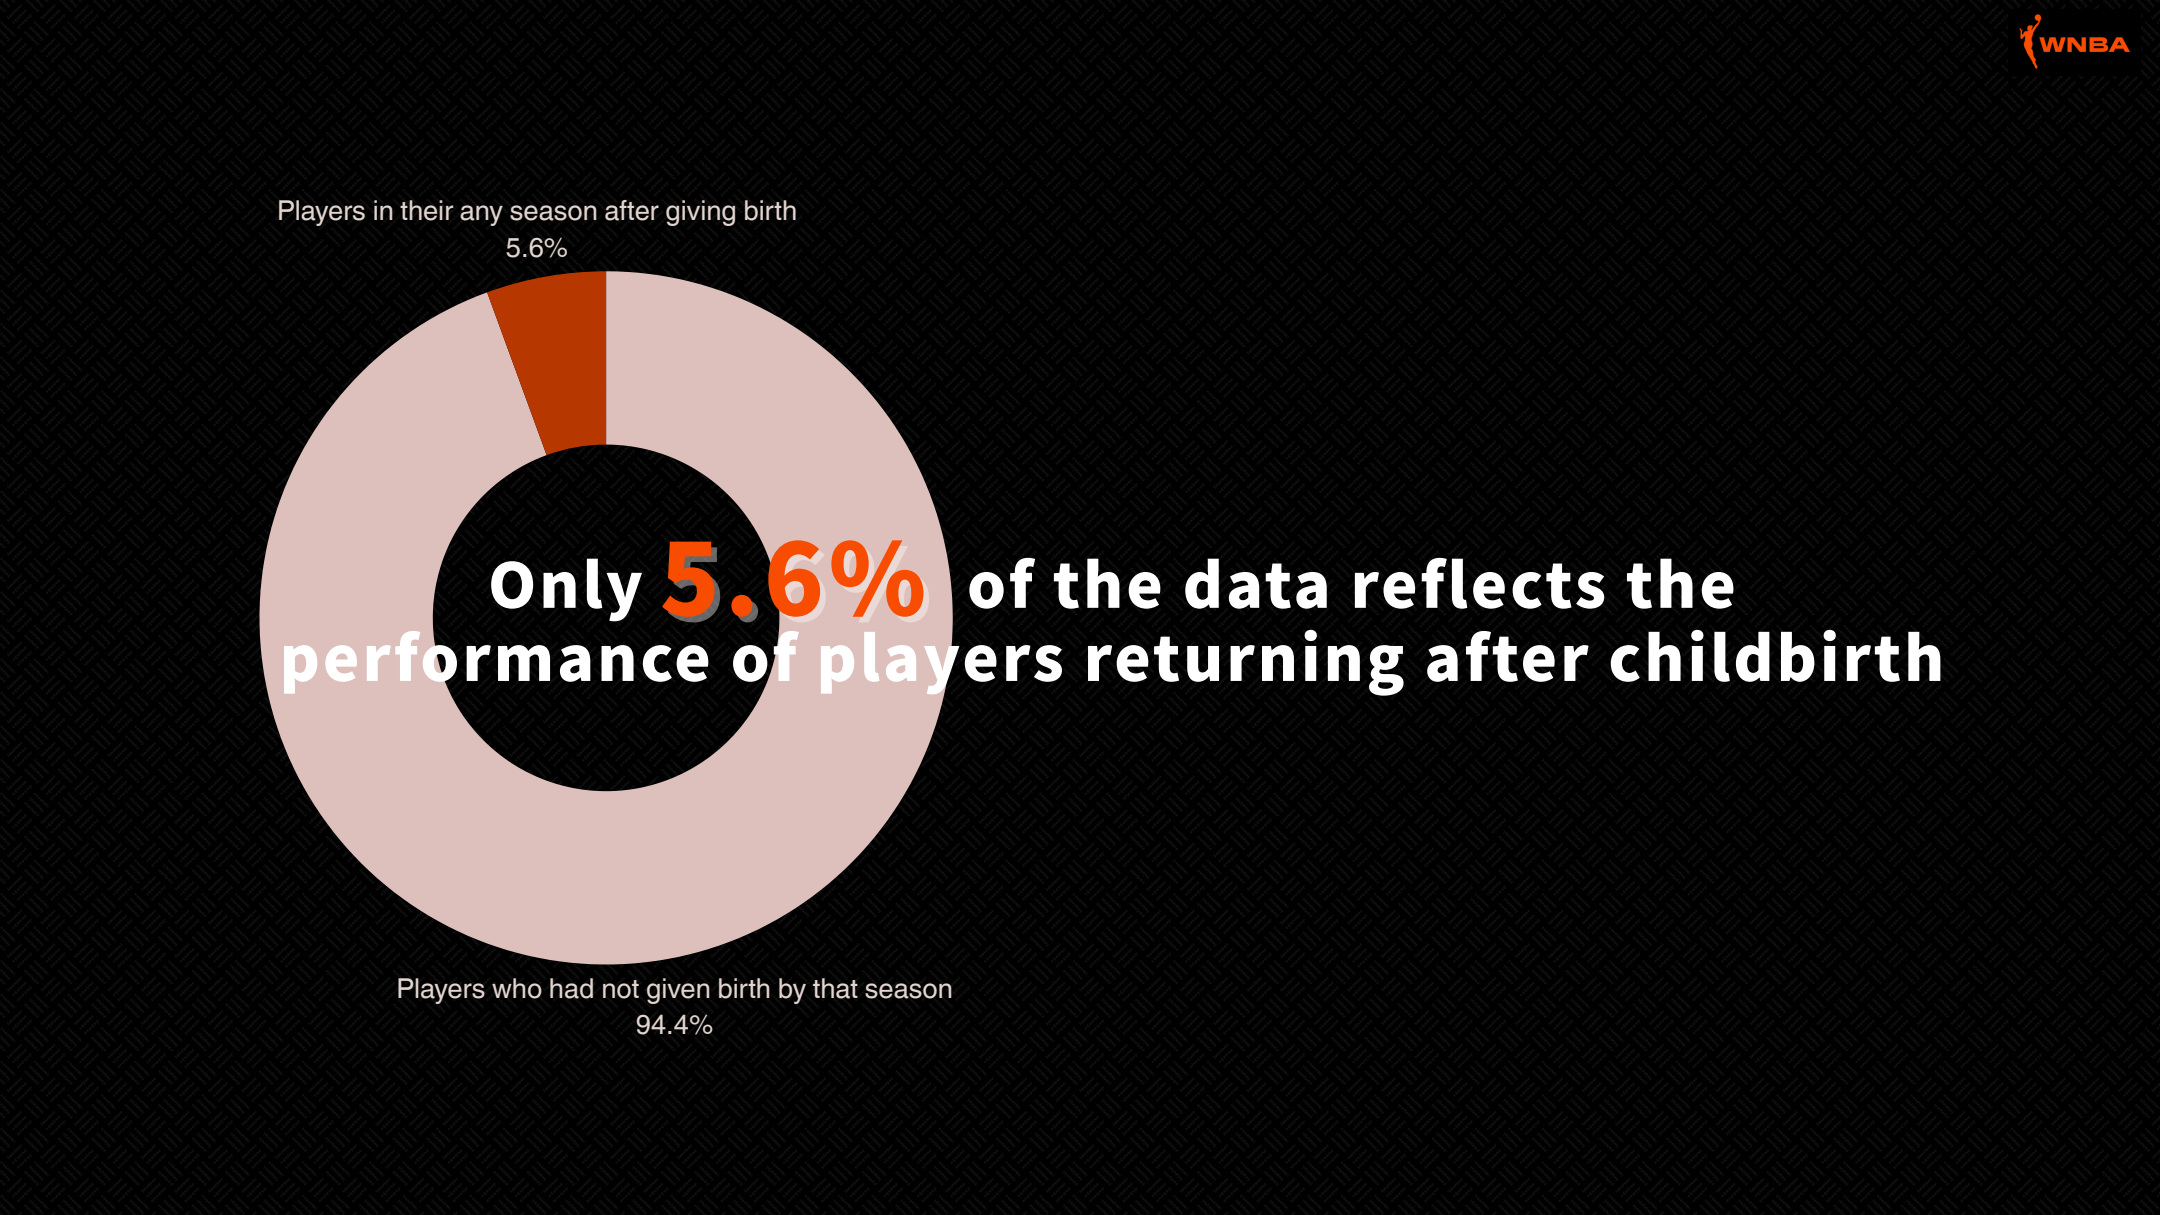
Would childbirth necessarily mean a decline in performance? I didn’t see a consistent drop in the charts, but only 5.6% of the cleaned records represented seasons after childbirth. And what about players who never returned? That missing part of the picture is something I would want to explore with more data.
Some guards were also earning high salaries close to or beyond forty. There were too few of them to build a general recommendation around, but I wanted to keep their careers visible without treating them as the norm.
Then I returned to the second half of the question: how much should a team offer?
The salary data, covering 2021–2024, showed some overlap between higher earnings and the age ranges I had been examining. I also looked at years of league experience separately from age. Salaries rose noticeably around the fifth year and generally increased with experience, although the later-career groups became smaller.
I didn’t think every team should receive the same offer recommendation. Their salary histories looked too different.
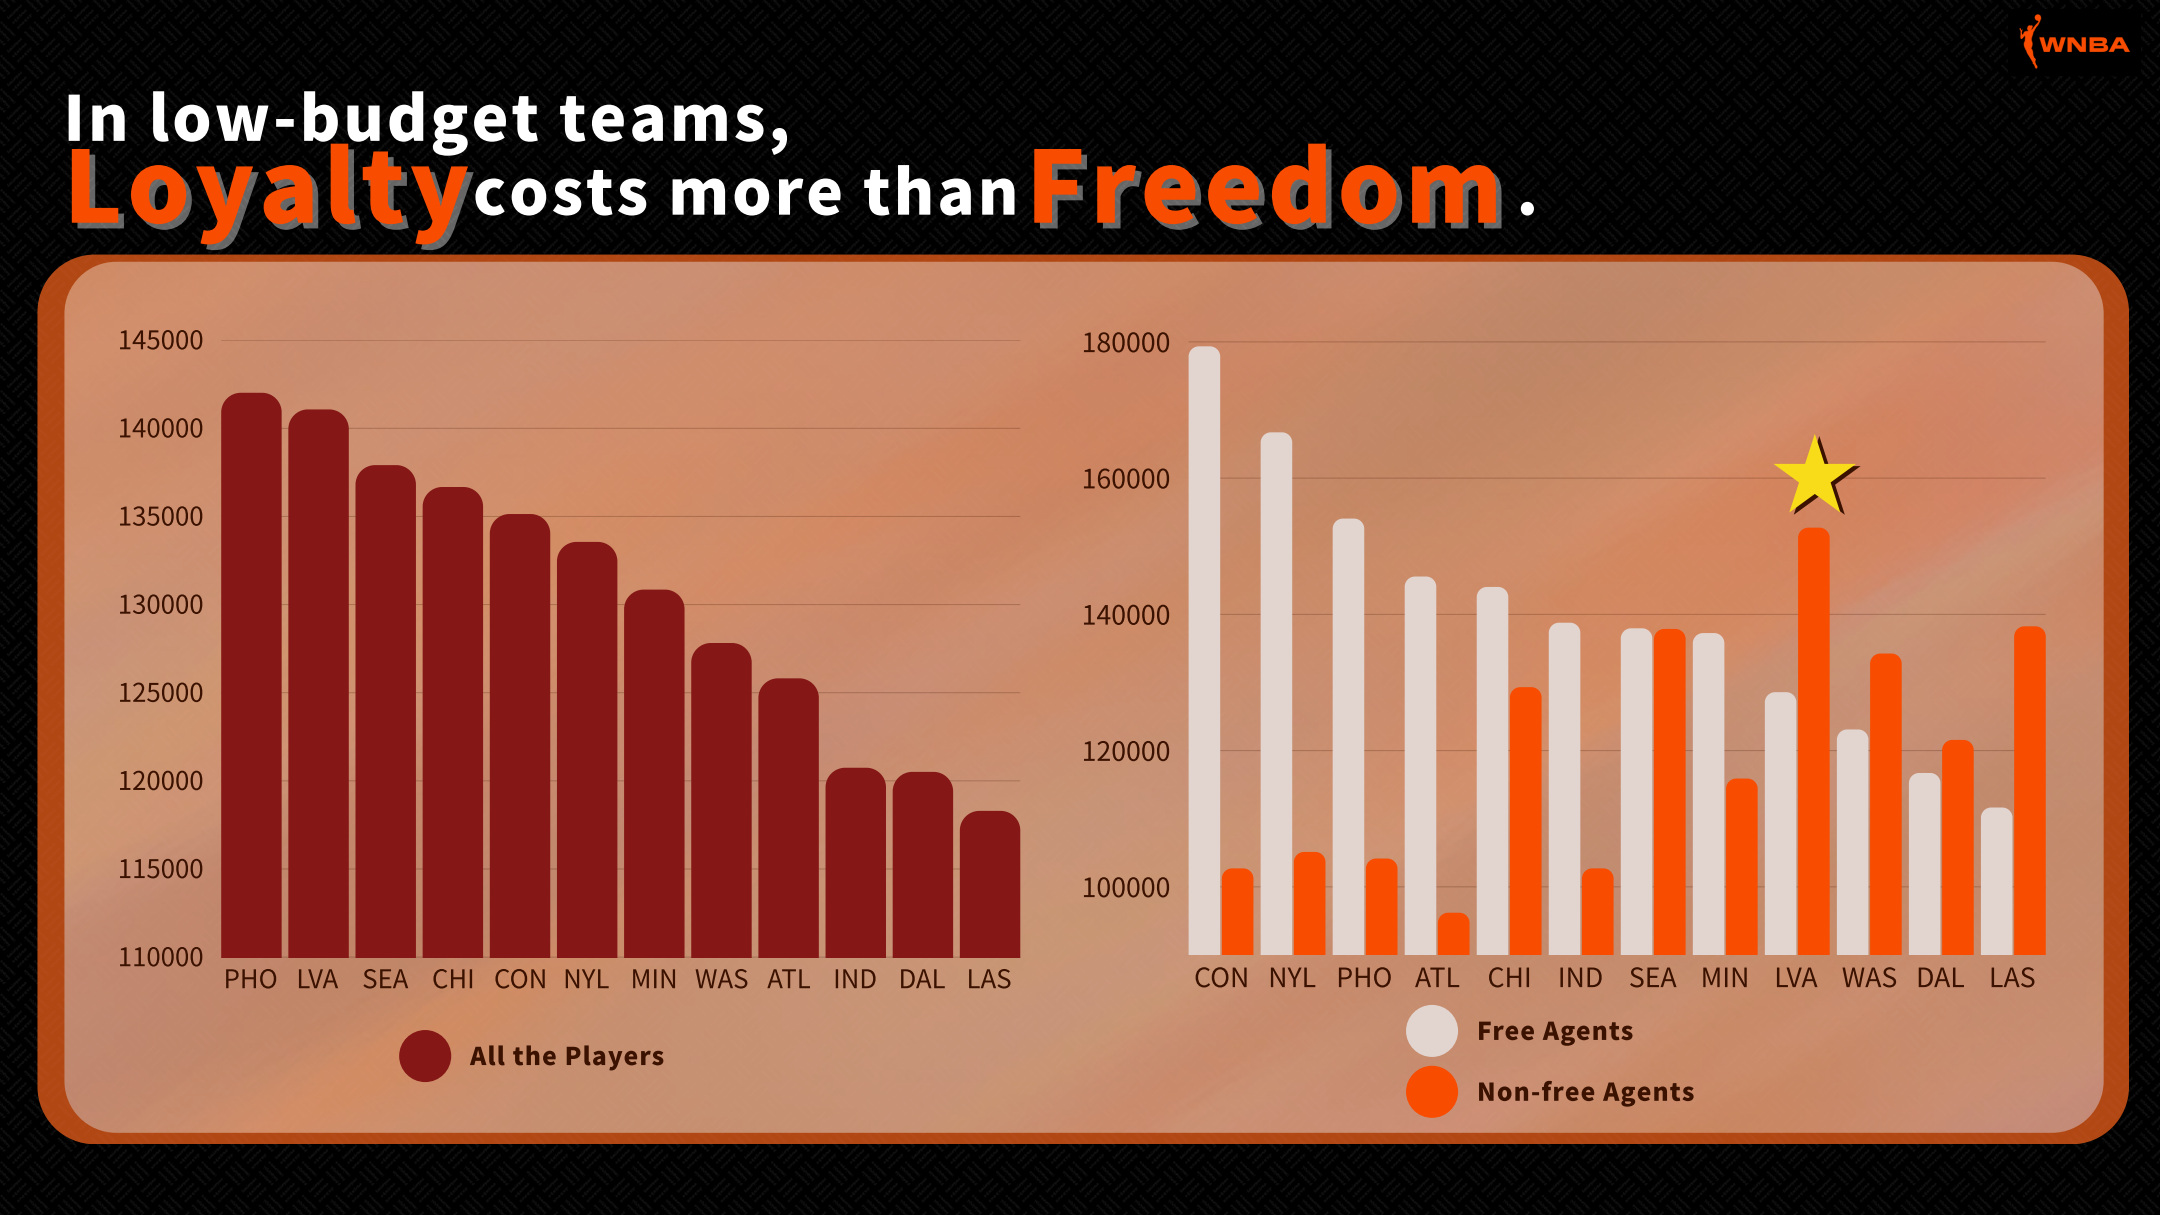
To understand those differences, I compared each team’s overall average salary, then separated free agents from non-free agents.
Las Vegas ranked near the top for overall average salary in my sample. Looking more closely, its non-free-agent salaries were higher than its free-agent salaries. Connecticut, meanwhile, had the highest free-agent average.
If I had stopped at overall team averages, I would have missed that difference. I grouped teams into three levels based on their historical average salaries for free agents, then used those groups to build different offer ranges.
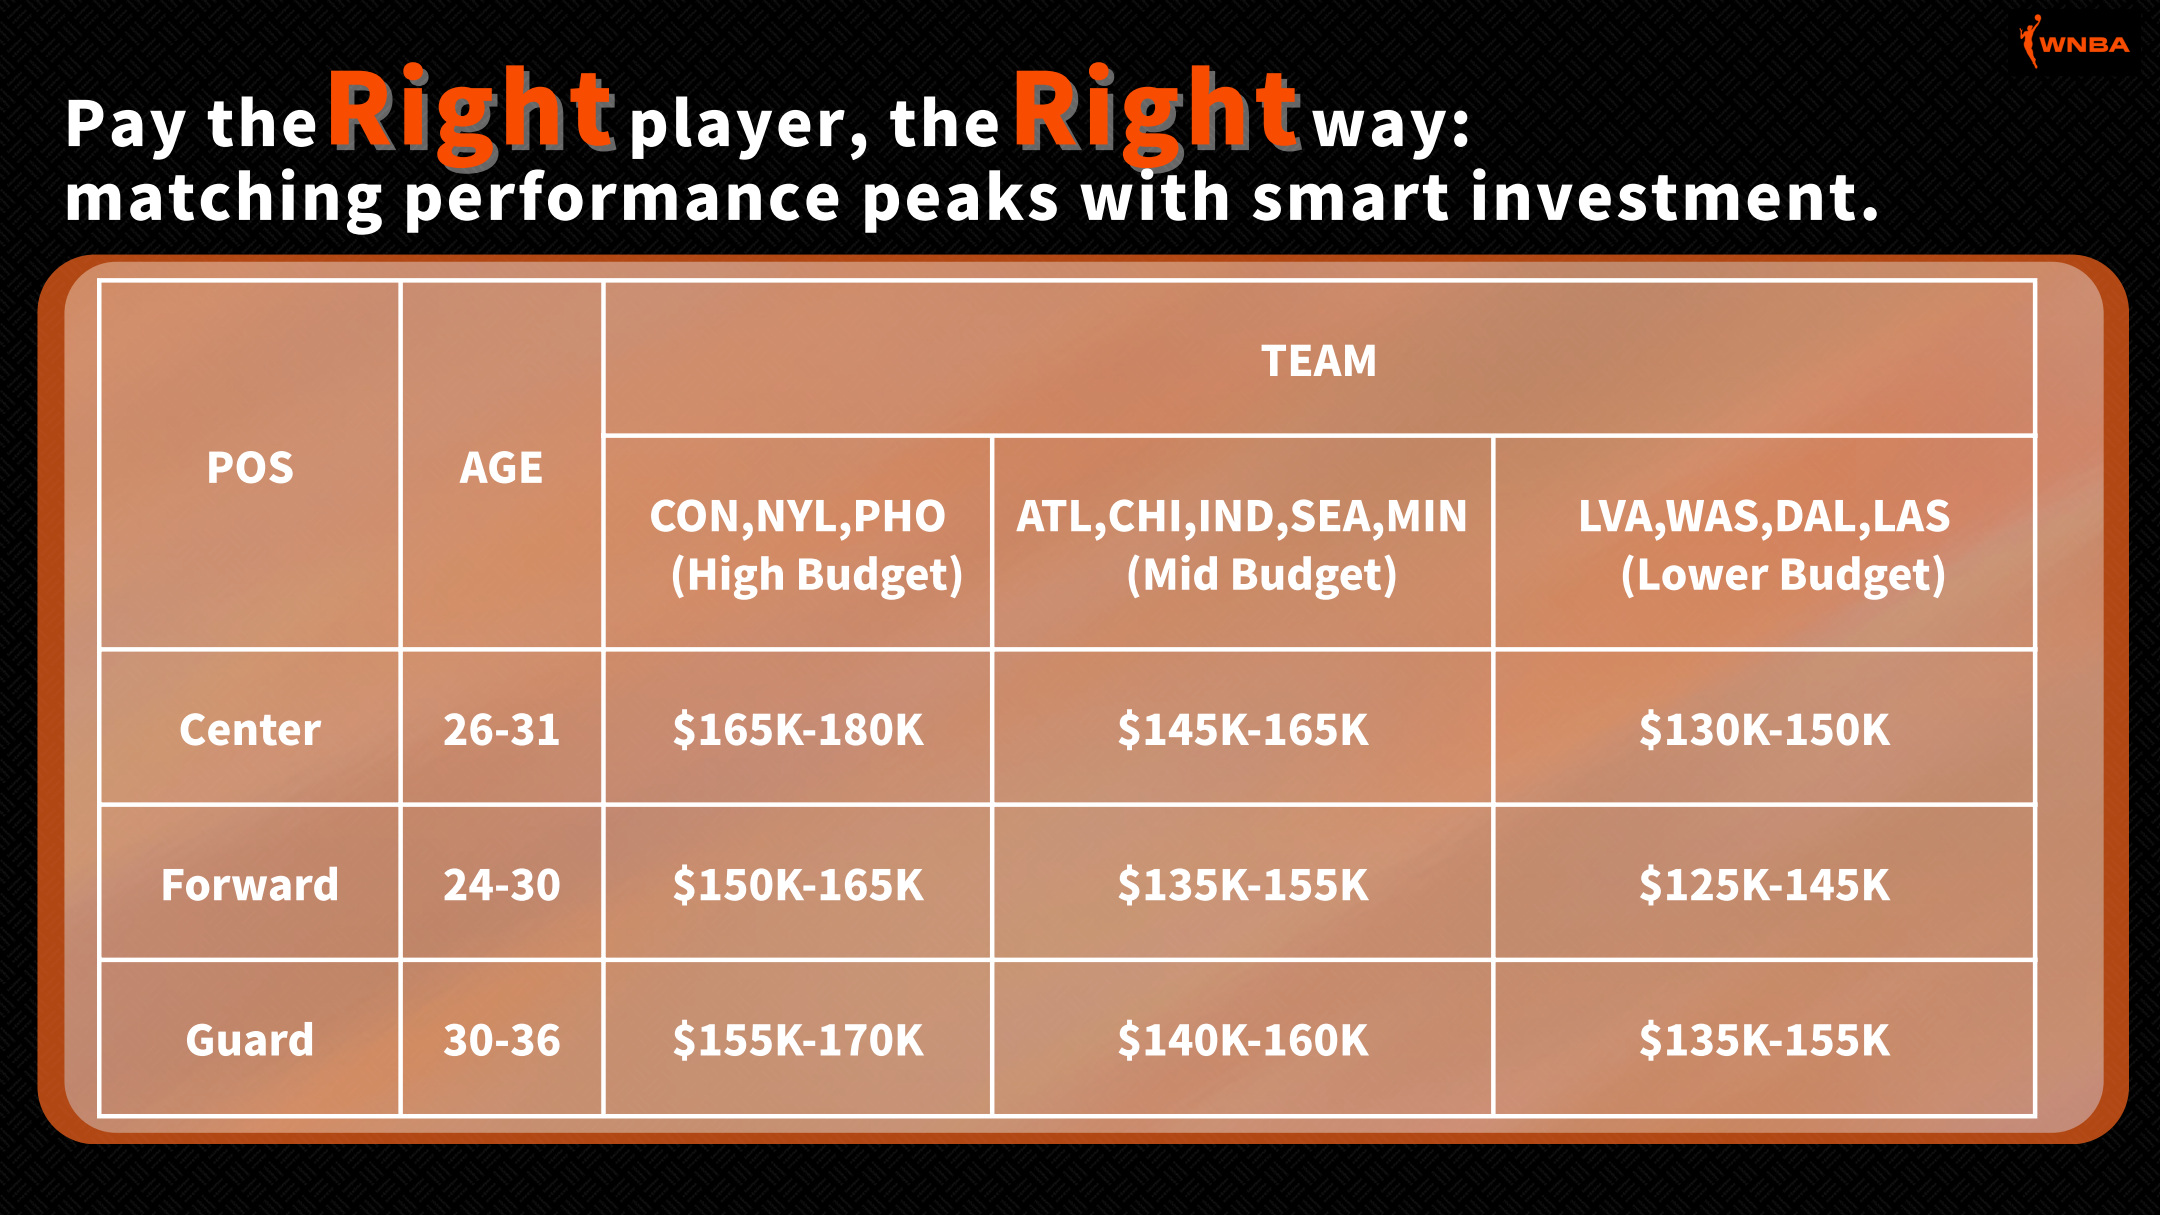
Finally, I brought position, age, and salary group together. I proposed looking at centers aged 26–31, forwards aged 24–30, and guards aged 30–36, with different salary ranges for each team group.
For a team in the middle group looking for a center, for example, my suggested offer was $145K–$165K. It was a starting point for a conversation, with a reason behind each part of the suggestion.
Getting to the recommendation was only part of the work. I had to make it understandable.
The workbook contained much more analysis than I could reasonably present. For the deck, I chose the charts that moved the signing question forward and gave each slide a takeaway. The order mattered: understand the league, look at the positions, examine salaries, then bring the evidence together.
I wanted someone who had never opened the spreadsheet to understand the recommendation, follow the reasoning, and have something concrete to discuss. That shaped both the analysis I chose to show and the way I told the story.